This paper is available on arxiv under CC 4.0 license.
Authors:
(1) Matu´s Medo, Department for BioMedical Research, Inselspital, Bern University Hospital, University of Bern, Department of Radiation Oncology, Inselspital, Bern University Hospital, University of Bern and [email protected];
(2) Michaela Medova, Department for BioMedical Research, Inselspital, Bern University Hospital, University of Bern, and Department of Radiation Oncology, Inselspital, Bern University Hospital, University of Bern.
Table of Links
4. Materials and methods
4.1. Reference signatures
We used all signatures from version 3.0 of the COSMIC catalog (COSMICv3, https://cancer.sanger.ac. uk/signatures/sbs/), in particular the SBS signatures for human genome assembly GRCh38. COSMICv3 contains 67 mutational signatures (18 are artifact signatures) defined in 96 mutational contexts.
While newer COSMIC versions (the latest version is 3.3.1 from June 2022) added more signatures, profiles of the COSMICv3 signatures have not been altered (all absolute weight differences are below 10−7 ).
To measure the diversity of signature profiles, we compute their exponentiated Shannon index which is a common measure of diversity (Missa et al., 2016) that can be understood as the effective number of active mutational contexts.
For a signature whose all weight is concentrated in one context, the exponentiated Shannon index is one. For a signature with the same weight 1/96 of all contexts, the exponentiated Shannon index is 96. For COSMICv3 signatures, the exponentiated Shannon index ranges from 2.7 (SBS48) to 80.3 (SBS3).
4.2. Synthetic mutational catalogs
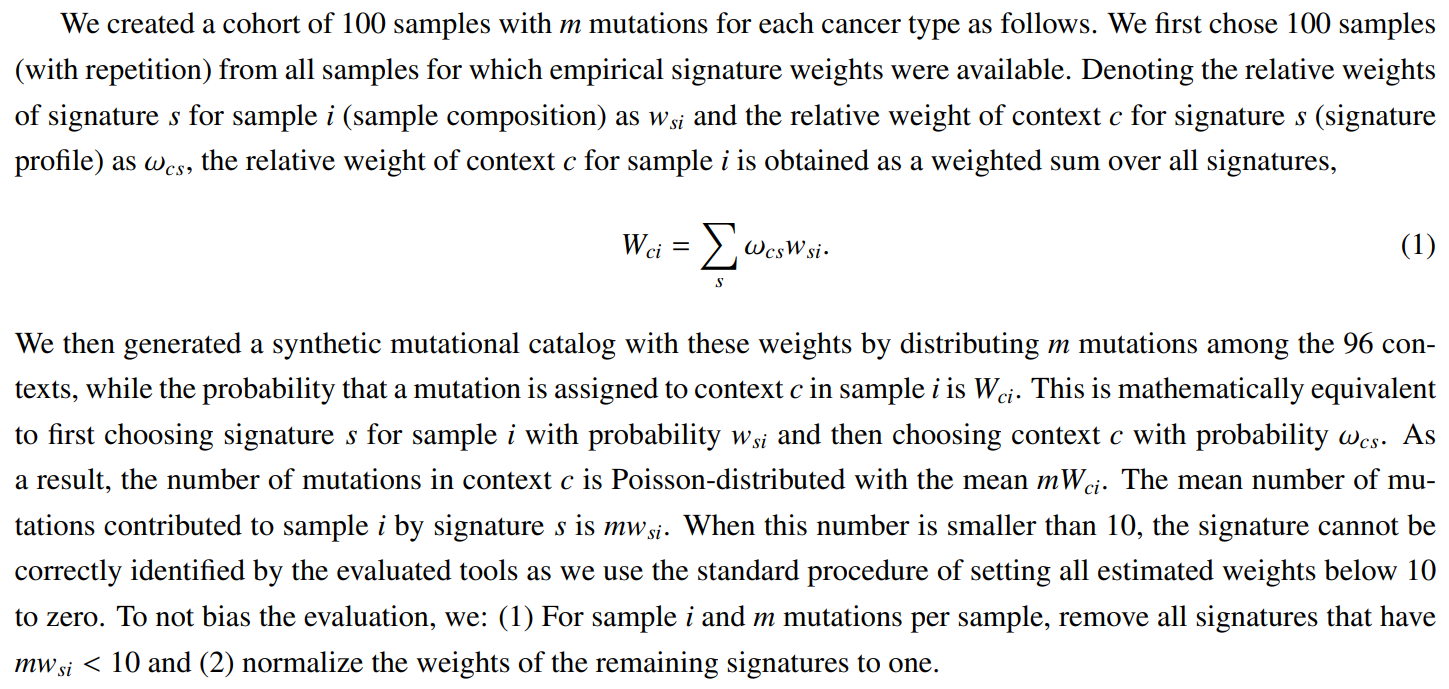
Absolute contributions of signatures to sequenced tissues from various cancer types were downloaded from the Catalogue Of Somatic Mutations In Cancer (COSMIC, https://cancer.sanger.ac.uk/signatures/sbs/, catalog version 3.2) on November 14, 2021 for all 46 non-artifact SBS signatures that have tissue contribution data available. These data included only samples with reconstruction accuracy above 0.90 and at least 10 mutations attributed to the specific SBS signature.
Using the provided unique sample identifiers, we used these files to compute the relative signature contributions in individual WGS-sequenced samples that are stratified by the cancer type.
We chose eight different cancer types for further analysis: Hepatocellular carcinoma (Liver-HCC, n = 422), stomach adenocarcinoma (Stomach-AdenoCA, n = 170), head and neck squamous cell carcinoma (Head-SCC, n = 57), colorectal

carcinoma (ColoRect-AdenoCA, n = 72), lung adenocarcinoma (Lung-AdenoCA, n = 62), cutaneous melanoma (Skin-Melanoma, n = 280), non-Hodgkin Lymphoma (Lymph-BNHL, n = 117), and glioblastoma (CNS-GBM, n = 63).

The approach described above allows us to reproduce empirical signature weights in previously analyzed samples without resorting to assumptions such as a log-normal distribution of the number of mutations due to a given signature (Alexandrov et al., 2020, Islam et al., 2022) or adding additional zeros to the Poisson distribution to reproduce signatures that are not active in a sample (Omichessan et al., 2019).
The code for generating synthetic mutational catalogs and evaluating the signature fitting tools is available at https://github.com/8medom/SigFitTest.
For Figure 6, we created synthetic mutational catalogs with a systematic difference in the activity of signature SBS40. After generating sample weights as described in the previous paragraph (assuming the CNS-GBM cancer type), the relative weights of SBS40 were multiplied by 1.3 in the first half of the samples and divided by 1.3 in the second half of the samples.
The relative weights of all signatures in each sample were then normalized to one. Note that signature SBS40 is active in nearly all CNS-GBM samples (Fig. SF9 in SI) and its median relative weight is close to 50%. By the described process, the median weights in the two groups of samples become 42% and 55%, respectively.
4.3. Tools for signature fitting
The task of fitting known mutational signatures to a mutational catalog consists of finding the combination of signatures from a reference set that “best” matches the given catalog. Denoting the matrix with reference signatures as S, where S cs is the relative weight of context c for signature s, and the given normalized mutational catalog as m, where mci is the fraction of mutations in context c in sample i, this amounts to solving

where wsi is the relative weight of signature s in sample i. Mathematically, this is an over-determined system as the number of reference signatures is smaller than the number of mutational contexts (96 contexts for the common SBS signatures).
Several fitting tools are therefore based on minimizing the difference between m and Sw through nonnegative least squares (as the signature weights cannot be negative) or quadratic programming.
We evaluated several tools that belong to this class: MutationalPatterns v3.4.1 (Blokzijl et al., 2018), YAPSA v1.20.1 (Hubschmann et al. ¨ , 2021), SigsPack v1.8.0 (Schumann et al., 2019), and sigminer v2.2.0 (Wang et al., 2021) which has three separate methods based on quadratic programming, non-linear least squares, and simulated annealing. We find that all these tools produce similar results.
Other tools use various iterative processes by which the provided set of reference signatures is gradually reduced by removing the signatures, for example, whose inclusion does not considerably improve the match between the observed and reconstructed mutational catalogs (or, opposite, signatures are gradually added as long as the reconstruction accuracy sufficiently improves).
We evaluated deconstructSigs v1.8.0 (Rosenthal et al., 2016), SigProfilerSingleSample v0.0.0.27 (Alexandrov et al., 2020), SigProfilerAssignment v0.0.30 (Diaz-Gay et al., 2023), mmsig v0.0.0.9000 (Rustad et al., 2021), and signature.tools.lib v2.2.0 (Degasperi et al., 2022), that all belong to this category. The newest tool, SigProfilerAssignment, combines backward and forward iterative adjustment of the reference catalog and these steps are repeated until convergence.
Finally, SigLASSO v1.1 combines the data likelihood in a generative model with L1 regularization and prior knowledge (Li, 2020, Li et al., 2020). To allow for a fair comparison with other tools, we did not use prior knowledge when evaluating sigLASSO.
In our experience, this tool sometimes fails to halt but starting it again with the same input data resolves the issue. A similar Bayesian framework is used by sigfit v2.2 (Gori and Baez-Ortega, 2020).
The authors of sigfit recommend setting all signatures whose lower bounds of the estimated 95% confidence intervals are below 0.01 to zero. The authors of deconstructSigs recommend setting all signatures whose relative weights are below 0.06 to zero. All results shown for sigfit and deconstructSigs follow these recommendations.
4.4. Trimming reference signatures
It has been argued that the removal of irrelevant reference signatures can improve the fitting results (Kim et al., 2021). To assess this hypothesis, we use a two-step process where: (1) We fit signatures using all COSMICv3 signatures as a reference and (2) keep only the signatures whose relative weight exceeds threshold w0 for at least 5 samples in our cohorts with 100 samples.
We use thresholds w0 = 0.05 (m = 100), w0 = 0.03 (m = 2, 000) and w0 = 0.01 (m = 50, 000) which correspond to absolute signature contributions 5, 60, and 500, respectively.
This pruning of reference signatures is beneficial when the number of mutations per sample is small (see m = 100 in Fig. S17 in SI). However, the converse is true when the number of mutations per sample is high, in particular for tools that perform well with COSMICv3 as a reference (m = 50, 000 in Fig. S17 in SI).
To overcome this problem, we have also tested a less strict pruning where we keep all signatures whose relative weight exceeds w0 for at least one sample (see Fig. S18 in SI for the results).
We have also tested the approach based on de novo extraction of signatures as suggested in (Maura et al., 2019). For signature extraction, we used SignatureAnalyzed v0.0.7 (https://github.com/getzlab/SignatureAnalyzer) with L1 prior on both W and H and a Poisson objective function for optimization.
As recommended in (Maura et al., 2019), each extracted signature was then compared with individual signatures from COSMICv3 as well as linear combinations of two signatures from COSMICv3.
The signature (or a pair of signatures) that yielded the smallest cosine distance was then added to the list of trimmed reference signatures for the given input data. When the number of mutations is small (m = 100), less than five signatures are selected, on average. When the number of mutations is large (m = 50, 000), 89% of the active signatures are selected, on average. A comparison of the results obtained by the two reference-trimming schemes is shown in Fig. S19 in SI.
4.5. Evaluation metrics
Recent literature often classifies fitting results as true positives, false positives, true negatives, and false negatives, which allows computing evaluation metrics such as precision and specificity Omichessan et al. (2019), Islam et al. (2022), Diaz-Gay et al. (2023).
We use instead quantitative metrics that measure the differences between the true relative signature weights (which are used to generate the input mutational catalogs) and the estimated relative signature weights.
For tools that estimate absolute signature weights, those are first normalized by the number of mutations in each sample.

and average it over all samples in the cohort to obtain fitting error. The lowest fitting error, 0, is achieved when the estimated signature weights are exact for all signatures and all samples. The highest fitting error, 1, is achieved when the estimated signature weights sum to one for each sample but they are all false positives.
For example, when a sample has 40% contribution of SBS1 and 60% of SBS4 but a tool estimates 20% contribution of SBS2 and 80% contribution of SBS3, the fitting error is 1. There are some tools whose signature weight estimates do not sum up to one for each sample, typically as a result of the uncertainty implied by a small number of mutations in samples.
The fitting error of those tools can be inflated due to these tools’ conservativeness. However, we probed whether additionally normalizing the estimated weights to one improves the fitting error achieved by those tools and found that this is not the case. We can thus conclude that these tools are not disfavored by measuring their fitting error.
Another way to quantify the agreement between the true and estimated signature weights is by computing their Pearson correlation. For each sample where at least three signatures had positive either true or estimated weights, we computed the Pearson correlation coefficient between these two weight vectors whilst excluding all signatures that are zero for both of them. The obtained values were then averaged over all samples in the cohort.
We finally computed false positive weight which quantifies how much weight is assigned to the signatures that are not active in a given sample,

and then this quantity is averaged over all samples. This quantity too ranges from 0 (when no weight is assigned to inactive signatures) to 1 (when all weight is assigned to inactive signatures).
This paper is available on arxiv under CC 4.0 license.

